
Decoding Danger: Unveiling the Hidden Patterns of Road Accidents in the UK Through Data
Every time we step onto the road whether as a driver, cyclist, or pedestrian, we enter a complex ecosystem of movement, risk, and unpredictability. Some journeys end uneventfully, while others take an unfortunate turn. But what if we could uncover the hidden patterns behind these accidents? What if we could identify the times, places, and conditions that make the roads more dangerous?
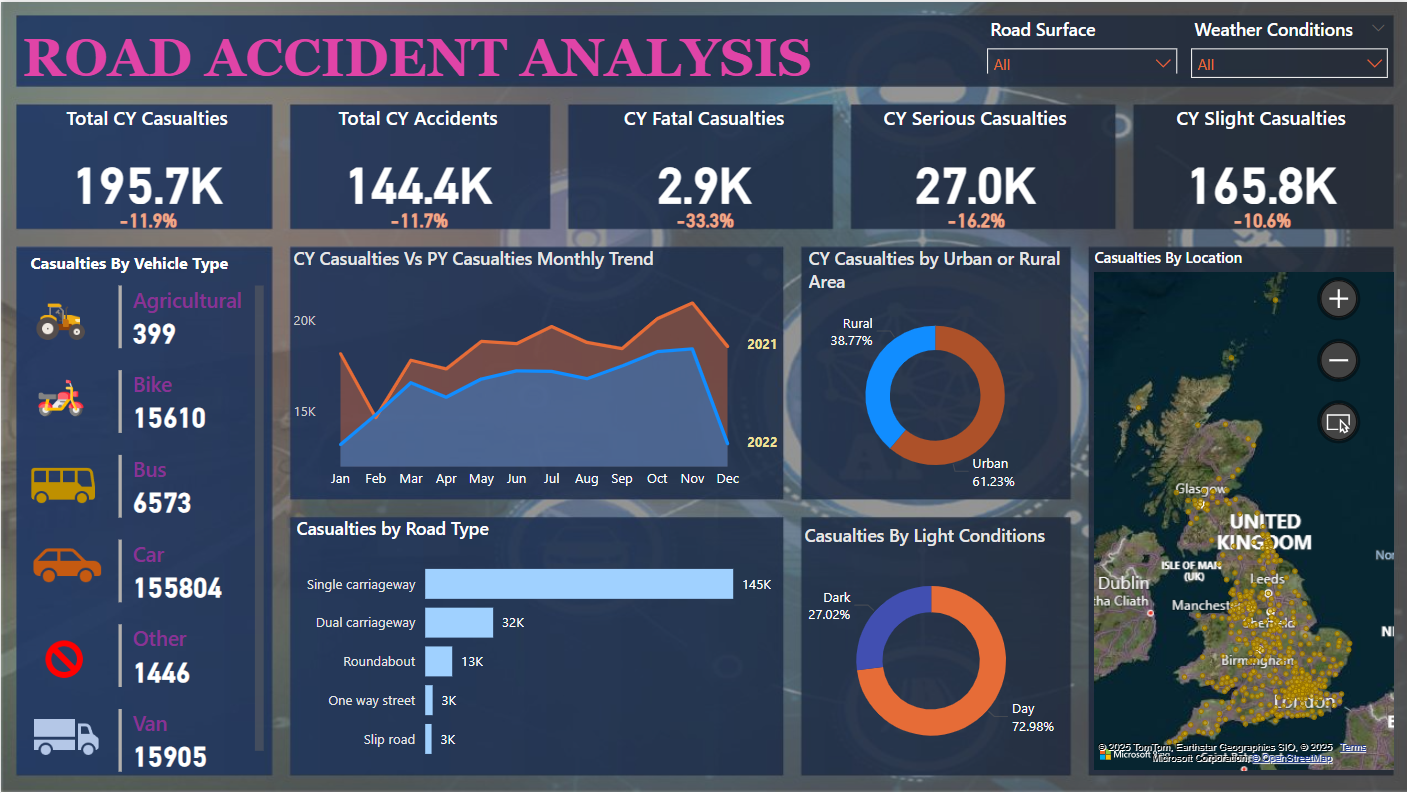
Armed with a comprehensive dataset of UK road accidents from 2021-2022, I embarked on a journey through data, using Power BI to visualise and unravel the trends shaping road safety. The insights were not just numbers on a dashboard; they painted a vivid picture of how and why accidents happen.
When and Where Do Accidents Strike the Hardest?
Imagine you’re setting off on a Monday morning, rushing to work. You’re not alone. Thousands of other commuters are doing the same, filling roads with impatient drivers, hurried decisions, and unexpected obstacles. The data confirmed what many of us instinctively feel, Mondays and Fridays saw the highest number of road accidents, coinciding with the rush to start and end the workweek.
The clock also told a compelling story. Accidents spiked during morning rush hours (8:00-10:00 AM) and evening commutes (4:00-7:00 PM). The familiar chaos of bumper-to-bumper traffic, last-minute lane changes, and distracted driving were all reflected in the numbers.
And then there was the influence of the seasons. The colder months of autumn and winter—showed a noticeable uptick in accidents. Was it due to icy roads? Heavy rain? Surprisingly, the majority of accidents occurred on clear days with dry roads, debunking the common assumption that bad weather is the primary cause. Instead, human error played a far bigger role than the environment.
The Role of Roads, Speed, and Light
If you had to guess where most accidents happened, would you say motorways? High-speed country roads? In reality, the greatest number of accidents occurred in urban areas, particularly on roads with a 30-mph speed limit. These roads, often lined with shops, homes, and pedestrian crossings, are filled with unpredictable interactions between vehicles, cyclists, and people on foot.
Another revelation emerged from the road surface conditions. While we expect rain, ice, and fog to be major contributors to accidents, dry roads accounted for most incidents. However, when accidents did happen on wet or icy roads, they were far more likely to be serious. A slippery surface, combined with high speed, often meant the difference between write a blogpot onThen there was the matter of light. Driving at night always feels riskier, but the data brought an interesting nuance: most accidents happened in daylight. However, those that did occur in darkness especially on unlit roads tended to be more severe. The absence of streetlights, combined with reduced visibility, created conditions where reaction time was significantly impaired.
The Vehicles That Dominate the Roads
Not all vehicles face equal risk on the road. Cars, unsurprisingly, were the most involved in accidents, simply because they are the most common mode of transport. However, motorcycles stood out for a different reason—they were disproportionately represented in severe accidents. Two wheels, high speeds, and exposure to external impact made motorcyclists particularly vulnerable.
And then there was the matter of multi-vehicle collisions. As expected, these led to a higher number of casualties per incident. Whether it was a minor fender bender at a busy junction or a high-speed crash on a motorway, when more vehicles were involved, the chances of injury increased.
Lessons from the Data: A Call for Safer Roads
Beyond the statistics and visualisations, this analysis reinforced a sobering truth: road safety is as much about human behaviour as it is about infrastructure. While external conditions—weather, light, and road type—play a role, the vast majority of accidents happen when drivers, pedestrians, and cyclists fail to anticipate risks and make split-second mistakes.
Through Power BI, I was able to take this massive dataset and transform it into a compelling story, one that doesn’t just present numbers but offers actionable insights. The ability to detect patterns, highlight risk factors, and communicate findings in an engaging, meaningful way is what makes data analysis so powerful.
If you are looking for someone who can turn raw data into impactful stories and insights, feel free to connect. Because in the end, data isn’t just about numbers—it’s about the stories hidden within them.